User:Jbakker/projects/FasterAnimationPlayback/Spring Scene Analysis
Spring Scene Analysis
In order to find areas of improvement I went over the animation scenes of the Spring open movie. These scenes can be found at https://cloud.blender.org/p/spring/5cb07dbb808c0e74d46eed37.
BaseLine
Used Hardware
- AMD Ryzen 1700
- 16GB Ram 2400mhz
- AMD Vega 64
- Ubuntu 18.04.3
- Attached to a 4k screen
Used Additional Software
hotspot-v1.2.0-x86_64.AppImage
Blender
- Blender 2.83 master [cc516b82ef]
- Compiled with
RelWithDebInfo
Apply the next patch.
diff --git a/source/blender/depsgraph/intern/depsgraph_eval.cc b/source/blender/depsgraph/intern/depsgraph_eval.cc
index 7e7ab07825f..3ea5bda80bf 100644
--- a/source/blender/depsgraph/intern/depsgraph_eval.cc
+++ b/source/blender/depsgraph/intern/depsgraph_eval.cc
@@ -29,6 +29,8 @@
 #include "BLI_listbase.h"
 #include "BLI_utildefines.h"

+#include "PIL_time_utildefines.h"
+
 extern "C" {
 #include "BKE_scene.h"

@@ -68,6 +70,7 @@ void DEG_evaluate_on_refresh(Main *bmain, Depsgraph *graph)
 /* Frame-change happened for root scene that graph belongs to. */
 void DEG_evaluate_on_framechange(Main *bmain, Depsgraph *graph, float ctime)
 {
+  TIMEIT_START_AVERAGED(DEG_evaluate_on_framechange);
   DEG::Depsgraph *deg_graph = reinterpret_cast<DEG::Depsgraph *>(graph);
   deg_graph->ctime = ctime;
   /* Update time on primary timesource. */
@@ -82,6 +85,7 @@ void DEG_evaluate_on_framechange(Main *bmain, Depsgraph *graph, float ctime)
   /* Perform recalculation updates. */
   DEG::deg_evaluate_on_refresh(deg_graph);
   deg_graph->need_update_time = false;
+  TIMEIT_END_AVERAGED(DEG_evaluate_on_framechange);
 }

 bool DEG_needs_eval(Depsgraph *graph)
diff --git a/source/blender/draw/intern/draw_manager.c b/source/blender/draw/intern/draw_manager.c
index adaa1dd6151..95f03ff239a 100644
--- a/source/blender/draw/intern/draw_manager.c
+++ b/source/blender/draw/intern/draw_manager.c
@@ -73,6 +73,8 @@

 #include "IMB_colormanagement.h"

+#include "PIL_time_utildefines.h"
+
 #include "RE_engine.h"
 #include "RE_pipeline.h"

@@ -1410,7 +1412,7 @@ void DRW_draw_render_loop_ex(struct Depsgraph *depsgraph,
                              GPUViewport *viewport,
                              const bContext *evil_C)
 {
-
+  TIMEIT_START_AVERAGED(DRW_draw_render_loop_ex);
   Scene *scene = DEG_get_evaluated_scene(depsgraph);
   ViewLayer *view_layer = DEG_get_evaluated_view_layer(depsgraph);
   RegionView3D *rv3d = region->regiondata;
@@ -1534,6 +1536,7 @@ void DRW_draw_render_loop_ex(struct Depsgraph *depsgraph,
   /* Avoid accidental reuse. */
   drw_state_ensure_not_reused(&DST);
 #endif
+  TIMEIT_END_AVERAGED(DRW_draw_render_loop_ex);
 }

 void DRW_draw_render_loop(struct Depsgraph *depsgraph,
Metrics
Frames Per Second
The actual frames per second that the user can verify.
- Start Blender
- load Scene to test
- start playback.
- look at the FPS indicated in the UI.
Depsgraph Time
- Start Blender
- Load Scene to test
- Set the main animator 3d view of the file to full screen (crtl-alt-space)
- start playback
- after a minute stop animation
- in console look at the average figure
Draw Time
- Start Blender
- Load Scene to test
- Set the main animator 3d view of the file to full screen (crtl-alt-space)
- start playback
- after a minute stop animation
- in console look at the average figure
Note this figure isn't accurate. I want to redo this and record the last frame render time. The average includes too many samples when starting blender that are really fast as they show the same scene. I updated some scenes with the new figures, but still downloading the other scenes to do a retest.
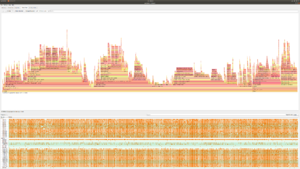
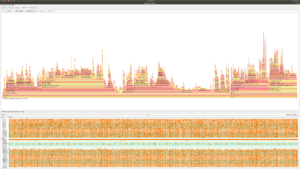
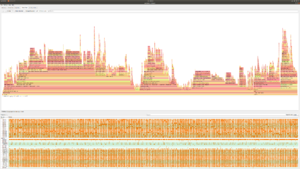
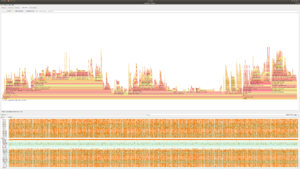
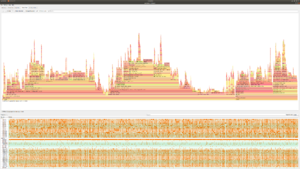
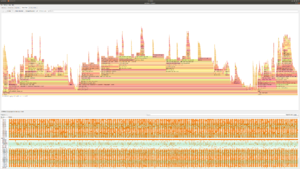
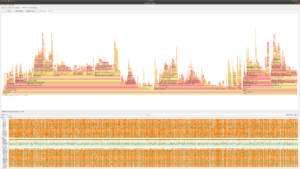
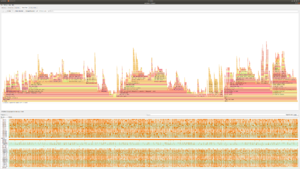
Flame Graph
- start blender via perf ()
- Load Scene to test
- Start playback
- After a minute stop playback
- Quit blender
- load perf in hotspot
- Go to Flame Graph
- select the timeframe where the animation is playing. Filter in on selection
- make a screen shot of the result.
sudo perf record -o /home/jeroen/reports/perf.data --call-graph dwarf --sample-cpu /home/jeroen/blender-git/build_linux/bin/blenderScenes
01_025_A.anim.blend
- FPS: 9.5
- time averaged (DEG_evaluate_on_framechange): 0.073477
- time end (DRW_draw_render_loop_ex): 0.008590
02_020_a.anim.blend
- 8.8 FPS
- time averaged (DEG_evaluate_on_framechange): 0.052770
- time end (DRW_draw_render_loop_ex): 0.030936
02_040_a.anim.blend
- 3.9 FPS
- time averaged (DEG_evaluate_on_framechange): 0.113819
- time end (DRW_draw_render_loop_ex): 0.063630
02_055_A.anim.blend
- 14.25 FPS
- time averaged (DEG_evaluate_on_framechange): 0.036567 (total: 35.616497, in 974 runs)
- time end (DRW_draw_render_loop_ex): 0.023571
03_005_A.anim.blend
- 7.8 FPS
- time averaged (DEG_evaluate_on_framechange): 0.053629
- time end (DRW_draw_render_loop_ex): 0.041649
This file has a fluid modifier... I think it used to have a smoke simulation, but that got converted to a fluid modifier due to mantaflow. It also seems that a lot of allocations happen during the fluid modifier. We might find some low hanging fruit here.
03_035_A.anim.blend
- 3.4 FPS
- time averaged (DEG_evaluate_on_framechange): 0.159914
- time end (DRW_draw_render_loop_ex): 0.080717
04_070_B.anim.blend
- 2.9 FPS
- time averaged (DEG_evaluate_on_framechange): 0.187593
- time averaged (DRW_draw_render_loop_ex): 0.076978
05_030_A.anim.blend
- 2.9 FPS
- time averaged (DEG_evaluate_on_framechange): 0.172747
- time end (DRW_draw_render_loop_ex): 0.114026
05_025_A.anim.blend
- 6.5 FPS
- time averaged (DEG_evaluate_on_framechange): 0.059501
- time end (DRW_draw_render_loop_ex): 0.067520
First impression
Still need to do a more in-depth research to get some actual findings. This is what I have so far, but it should not be interpreted as my final result.
Attention points
- Spring has been made using Blender 2.80 (alpha). In Blender 2.83 the scene behave different than in Blender 2.80. Some of these changes that I am aware of are
- Workbench has been rewritten
- Overlay engine has been rewritten
- Manta flow is used for smoke simulations.
- Different threading model (BTT)
- Some scenes uses a smoke simulation. as the smoke sim has been migrated to manta flow it doesn't reflect the action scenes animators are working in.
- TODO: Check with Hjalti/Andy how to handle this situation for this performance project.
- Mantaflow is fairly new and might be improved as I do see many allocs/frees.
- Threading could be improved in different areas. A lot of time is spend in the
current_vcpufunction in linux. (for example05_025_A) - Could be based on the slow single threading or the GPU driver but I do see a long single threaded execution in every frame. I do think this is related to the whole wm loop, drawmanager/opengl and driver. Can we use the idle time of the other threads to do something for the next frame? Hardest thing is to accurate determine what is the next frame.
- When an area is maximized there are still other areas that can be redrawn. Seems not needed.
