User:Grzelins/GSoC2020/ProjectDetails
< User:Grzelins | GSoC2020
Technical details and study of GSoC info editor improvements
Right now this document serves as notes for me, I am constantly updating it.
Info editor - current status
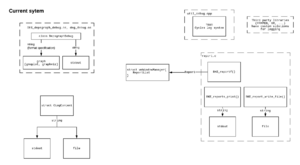
- info editor operated directly on
ReportListfromwmWindowManager - drawing rows (
textview_draw) is shared withspace_console - there is some code left over from 2.79 which seems to no longer belong to this directory (like
pack_libraries_exec) - keymap is set in
def km_info(params)
Logs - current status
Log is fine detail info visible only in console, to change log settings you need to start blender with appropriate --log* flag. Many files creates logger locally ex. static CLG_LogRef LOG = {"ed.undo"};. CLG_LogRef is only reference, memory is owned by CLogContext and stored in CLG_LogType.
Simplifying, there is one logger "type" wrapped in several functions and macros which ends with puts function. Logging function takes log as string - this string is already formatted.
Logging macros (CLOG) enforce text structure:
<LEVEL> (<LOG_ID>): <SOURCE_FILE>:<LINE_NUMBER> <FUNCTION_NAME>: <CUSTOM_MESSAGE>
Example:
INFO (wm.msgbus.sub): /home/mat/blender-sources/blender-src/source/blender/windowmanager/message_bus/intern/wm_message_bus_rna.c:292 WM_msg_subscribe_rna_params: rna(id='<none>', Object.mode, info='view3d_main_region_message_subscribe')
There are around 420 CLOG entries in code (grep -r CLOG | wc -l).
- each logger has id
static CLG_LogRef LOG = {"bke.action"}; - log filtering is very basic (
clg_ctx_filter_check) CLG_LogRefis initialized withCLOG_ENSURE(which callsCLG_logref_init) - every time you useCLOG_INFOthere is optional call toCLOG_ENSURECLogContextstore pointer toFILEthus can be dumped to disk- logs are not saved in memory: immediately after print, message string is destroyed
- todo how is log enabled/disabled on the fly?
- calling
CLG_type_filter_exclude,CLG_type_filter_includefromarg_handle_log_setaffects fiedCLG_IDFilter *filters[2]; - information from filters is used to set flag in
CLG_LogType
- calling
if (clg_ctx_filter_check(ctx, ty->identifier)) {
  ty->flag |= CLG_FLAG_USE;
}
Logs from depsgraph
- most prints are done in
DEG_debug_print_*and in macro likeDEG*_DEBUG_PRINTFbut there are also multiple prints all across code - debug graphs are drawn with gnuplot and/or graphviz (
blender\source\blender\depsgraph\DEG_depsgraph_debug.h)
Logs from third party libraries
todo investigate:
- GPU
gpu_debug_init - ffmpeg
- XR
GHOST_kXrContextDebug - what is going on with freestyle??
blender\source\blender\freestyle\intern\view_map\ViewMapBuilder.cpp
namespace Freestyle {
// XXX Grmll... G is used as template's typename parameter :/
static const Global &_global = G;
#define LOGGING 0
blender\source\blender\imbuf\intern\cineon\logImageCore.c?- ...
Debug - current status
Debug is flag which is set in global structure G. We have ~20 G_DEBUG* flags.
Typical usage for debugs:
if (G.debug & G_DEBUG) {
  printf("Error: No active view for painting\n");
}
It is common to see file-wide mini debug macro like:
#define DEBUG_PRINT(x) \
  if (AVI_DEBUG) { \
    printf("AVI DEBUG: " x); \
  } (void)0
Some debug is defined only in debug builds or specific flags enabled:
#ifdef DEBUG
void BLF_state_print(int fontid)
#endif
but sometimes it is wrapped in both define and if:
#if LOGGING
    if (_global.debug & G_DEBUG_FREESTYLE) {
      cout << "something";
    }
#endif
- do we want to have some kind of convention for debugging? Every
if (G.debug)is small performance penalty, so maybe have it always wrapped in#if? - todo what is going on with macro
NDEBUG?
Reports - current status
- reports (
Report,ReportList) are part ofwmWindowManager - because reports are part of window manager they can be displayed immediately
- report interface is created by
uiTemplateReportsBanner,UI_popup_menu_reports(actual popup menu)
- report interface is created by
ReporthasReportType(enum likeRPT_DEBUG,RPT_PROPERTY...)Reporthas flagReportListFlags( enum likeRPT_PRINT,RPT_STORE...)ReportTimerInfocontrols reports display timeReportListis used in multiple places: curves, mesh, ffmpeg, gpencil, everywhere where user needs to see message right now- report can be displayed in info editor
- info editor listens for new reports in
info_main_region_listener(listens for specific event inwmNotifier) and redraws region
- info editor listens for new reports in
- when blender runs in background reports are printed to stdout, see
BKE_report
Example usages:
   BKE_reportf(reports, RPT_ERROR, "KeyConfig '%s' cannot be removed", keyconf->idname);
   BKE_reportf(reports, RPT_ERROR, "KeyConfig '%s' cannot be removed", keyconf->idname);
   BKE_reportf(data->reports, RPT_WARNING, "Path '%s' cannot be made absolute", path_src);
Some usages of report look a bit like log:
   BKE_reportf(op->reports, RPT_INFO, "Copied %d selected object(s)", num_copied);
   BKE_reportf(op->reports, RPT_ERROR, "Parse error in %s", __func__);
Python API - current status
bpy.app.debug*exposes 17 flags fromG.debug, some are missing- it seems it is not possible to assign button to
bpy.app.debugfrom python script. todo how to implement it?- should it be converted to RNA bool property?
- todo investigate how ui menu debug_value is implemented -
wm_debug_menu_exec - todo investigate
pfunction inblender\release\scripts\addons\blenderkit\utils.py
Python error reporting
- python is evaluated in
BPY_execute_text - evaluating from text editor:
- syntax error are shown in info editor (although not great), but not execution errors. The difference is that syntax errors are reported during compilation in
python_script_exec - the real question is how to capture error from
PyEval_EvalCodehttps://stackoverflow.com/questions/4307187/how-to-catch-python-stdout-in-c-code
- syntax error are shown in info editor (although not great), but not execution errors. The difference is that syntax errors are reported during compilation in
CLI - current status
   Logging Options:
   --log <match>
   --log-level <level>
   --log-show-basename
   --log-show-backtrace
   --log-show-timestamp
   --log-file <filename>
   Debug Options:
   -d or --debug
   --debug-value <value> Set debug value of <value> on startup.
   --debug-*
   ...
   --debug-all
   --disable-crash-handler
   --disable-abort-handler
   ...
   --verbose <verbose>
- todo what is the difference verbose vs log-level?
- todo how will be CLI impacted?
Misc questions/issues
- todo what is replay system? T68656
- is
BLI_assertmeant to crash blender, or is it log-able? - what does
ATTR_PRINTF_FORMATdo? - it seems that blender show in ui exactly what is in the structure when it comes to info editor. Is there some kind of view layer in blender at all?
- inaccuracy of info editor: (ex T61525)
- when switching for ex. between object mode and edit mode tooltip:
- tooltip shows:
bpy.ops.object.mode_set(mode='EDIT') - info edit shows:
bpy.ops.object.editmode_toggle()
- tooltip shows:
- reasons?
- is this pattern or edgecase?
- when switching for ex. between object mode and edit mode tooltip:
- left right arrow, space is active shortcut in info editor, I don't think this is desirable
- if logger is not initialized, weird things happen with verbiosity (it is not initialized?), todo check
CLOG_CHECKined_undo.c:114. It can be run only when both loggers are enabled what is counter intuitive:blender --debug --log-level -2 --log "ed.undo,bke.undosys" --verbose 2
Features/tasks/ideas/requirements
T68448 - parent task
UI
- filter: a checkbox for each G.debug flag (24 checkboxes? ouch)
- filter: a checkbox for each log type (42+ checkboxes? many more will appear as I convert prints to logs. ouch)
- filter: log level (type): info, error... D6926, P1320
- filter: show only logs, that can be executed in python console (usefull for addons, nice to have)
- search for log type (ex.
*undo*) - search for logged text
- log: use timestamp - should it be part of report by default?
- log: use basename
- set max log size (memory footprint) in preferences
- how to incorporate this design with presets (that blender will implement in future)?
- is it possible to expose graphs are drawn with gnuplot and/or graphviz as button?
- select log file
- highlight found text
- if blender is not build with FFMPEG, do not show G_DEBUG_FFMPEG in indo editor. Is it hard to implement?
- should we take into consideration option Developer extras from preferences?
Other
- show python evaluation logs in info editor
- we want logs to appear in console for server usage (
--background). Do we want to make feature to disable console logging and display logs only in info editor? - we want to be sure that logs print to console before blender crashes
- for server usage: do not store reports (logs at all), just print it to save memory
- log output python console and executed scripts from text editor to info editor
- manage memory required by logs, as memory usage will grow fast
- add operator that will print blender version, commit etc. as
Report - store log filers per space - if 2 info editors are open, you should be able to set different filters
- file
blender\source\blender\editors\space_info\info_ops.c(and related) should probably no longer be in info editor as it has been separated in 2.8. Where should it go?
- should debug settings be saved with blend file?
- expose blender log in python API as handler for python's built in logging module
- expose freestyle debugging in build system?
CLOGis plain C. Will it work out of the box in cpp?- some parts of blender can be build separately. How will it affect log system?
- do we want to support multiple log files? Ex one per info editor?
- Industry compat keymap: change selection pattern in info editor to be consistent with outliner
- are we able to show even more information in info editor?
- ex. user paints with weight paint brush -> info editor show affected points in python syntax
- ex. user moves vertex in edit mode -> info editor shows python operator for moving vertexs
- show code responsible for setting user hotkeys
- super usefull for reproducing bugs and developing addons
- it is basically encoding user behaviour into executable python
- missing in the Text Editor is that all error messages isn't written in the Info Editor or the Python Console
Outside of scope of this project
- real time log watching:
- logs that can be drawed on graph inside blender
blender\source\blender\depsgraph\intern\debug\deg_debug_stats_gnuplot.cc - values that can be observed like mouse movement, jobs performance
- logs that can be drawed on graph inside blender
- separate logs from different threads?
- pretty print logs:
- extend
Reportstruct to contain flag about formatting, ex.char format=PLAIN_TEXT orPYTHONorLOGS - todo investigate what Harleya has done in the past
- todo: for drawing: how can we implement child rows ?
- python console can also have pretty print enabled
- syntax highlighting for logs? can be reused from
text_format.c, we can change drawing engine to useTextLine
- extend
- just an idea: if report comes from operator, can we show in which menu is the button? like search operation (under F3) shows path to menu
Proposed changes
There is geat ammount of monkey work that can be done, namely converting blender prints to logs.
Personally I get the feeling like this whole report system is only fancy log system. It makes less and less sense to keep those systems separated. (we have 850 usages of BKE_report( and 430 usages of BKE_reportf(). But it may be just too much work (?).
Display log in info editor
Basic idea is to allow CLOG make some kind of reports.
Green arrow in the image represent connection to implement.
Note that memory management becomes a must.
Idea 1 extend Report structure to cover additional information coming from log system:
- we should extend
enum ReportTypeto cover log types coming from log system - todo is
ReportListgood enough for text search?
Idea 2 Introduce new LogReport type, use the same drawing engine to draw it
Pros
- flexibility
Cons
- better to reuse and change what is already written
Idea 3 let info editor store new instance of CLogContext.
Pros:
- in the current state,
CLogContexthas:- one file to write
- filters
Cons:
- we do not have system in place to handle multiple instances of
CLogContext:- we probably want to share list of types in some way (one call to
CLG_INFOwrites to every context?)
- we probably want to share list of types in some way (one call to
Expose log to python API
We can make one CLogContext instance especially for addons: addon can register new logger type what will make it possible to display in info editor.
This log should probably be only a handler for python's built in logging module.
todo make a concrete API here
UI
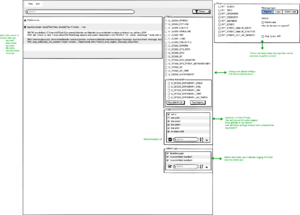
Info Editor
This is first iteration, it is a too technical for proper UI mocap, but it helps to organise my thoughts
Preferences
Add field "Memory Log limit" to System -> Memory & Limits Add field "Log file path" to File Paths -> Development?
- todo log path can be overriden from command line it would conflict with this preference setting


