Tools/Debugging/Python Visual Studio
Debugging blender python with Visual Studio
Update 2023-01
Visual studio breaks this feature often, it's best to consider this feature non functional and not sink any time into trying to get it to work.
The page below is archived in its original state in case a working version ships in a future Visual Studio version.
Relevant upstream ticket:
https://github.com/microsoft/PTVS/issues/6712
Introduction
Visual Studio 2017 offers integrated debugging of python. This guide will help you set it up for use with blender.
This guide assumes you already know how to build blender, if you have not yet done so, please follow the Building_Blender/Windows guide.
Prerequisites
Visual Studio 2017
Version 15.8.7 or later.
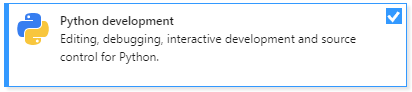
- In the visual studio installer, enable the
Python Developmentworkload

Visual Studio 2019
- Enable the Python Development Workload (just like for VS2017)
- Enable the "Python native development tools" individual component. This is not enabled by default with Python Development Workload, but is required for the "Python/Native Debugger" option to show up later.
Project Creation
You should already have used make.bat to build blender before, in this section we'll use it to generate a Visual Studio project with the options enabled we need for debugging python.
Open up a command prompt and navigate to the blender source folder and run make full 2017 x64 nobuild pydebug
1 Microsoft Windows [Version 6.1.7601]
2 Copyright (c) 2009 Microsoft Corporation.  All rights reserved.
3
4 C:\Windows\system32>cd /d k:\BlenderGit\blender
5
6 k:\BlenderGit\blender>make 2017 x64 nobuild pydebug
Tip:
Here's what each of the additional parameters mean.
|
After a few seconds, it should tell you where the project files have been written.
1 -- Configuring done
2 -- Generating done
3 -- Build files have been written to: K:/BlenderGit/build_windows_Full_x64_vc15_Release
Opening the project in visual studio
Navigate to the location and double click blender.sln
Selecting a configuration
You can build blender in both Debug and Release configurations.
Tip:
Debug is a specially optimized build for debugging code, this build of blender will be bigger and slower, but it will be easier to debug C/C++ code. Release is a highly optimized version of blender, it will be fast, but it will be problematic to diagnose issues in the C/C++ Code. |
You can switch between the builds in the Solution Configuration dropdown menu

Tip:
If you are only going to debug python code select the Release configuration, if you also need C/C++ debugging select Debug |
Building Blender
First we have to build blender, however just building blender is not enough, the output folder also needs to be populated with additional dll's and startup scripts for blender to run properly, so instead of just clicking build. Expand the CMakePredefinedTargets group , right click on the INSTALL project and select build

after a while the output window should show something along these lines
1 ========== Build: 149 succeeded, 0 failed, 0 up-to-date, 0 skipped ==========
Selecting the Python Debugger
Select Python/Native Debugger in the debugger dropdown.

Tip:
If this option is missing, this is most likely due to the Python Development workload not being installed, see the Prerequisites section on how to install. |
Setting a breakpoint
In the solution explorer, expand scripts/blender_python_system_scripts/addons/io_scene_obj, double click on __init__.py, and put a breakpoint on the register function by placing the cursor on the following line and pressing F9 or by clicking in the left margin of the line.
329 def register():
330     for cls in classes:
331         bpy.utils.register_class(cls)
332
333     bpy.types.TOPBAR_MT_file_import.append(menu_func_import)
334     bpy.types.TOPBAR_MT_file_export.append(menu_func_export)
Running blender
Start blender by either pressing the F5 key or clicking the play ![]() button.
button.
Blender will now start and after a few moments your breakpoint should hit.
Happy Debugging!
